Analyzing Kepler Data
This section will walk through an analysis of K2 data using online plotting tools and publicly available K2 data. We will focus on a planetary system around a star called HIP 41378, which was discovered in K2 data in 2016.
Plotting K2 Data Online
In this tutorial, we will be using an online plotting program called plot.ly. Plot.ly is free, but requires the creation of an account. Once you have created an account and logged in, the following welcome screen is shown. To create a new plot, click the "Create" button:

Creating a new plot will bring you to a new work area with several sub-frames. At the top right is an area to input data, at the lower right is the plot itself, and on the left is a menu with options for modifying the plot itself. The first thing we need to do is upload data to plot. For this, we will use the publicly available K2 data of HIP 41378, which is also known by its EPIC ID number 211311380. The data is available here, or can be accessed using the search form as described on Page 3 of this tutorial. Once you have downloaded the data, click the "Upload" button in the top right of the screen, as shown below:
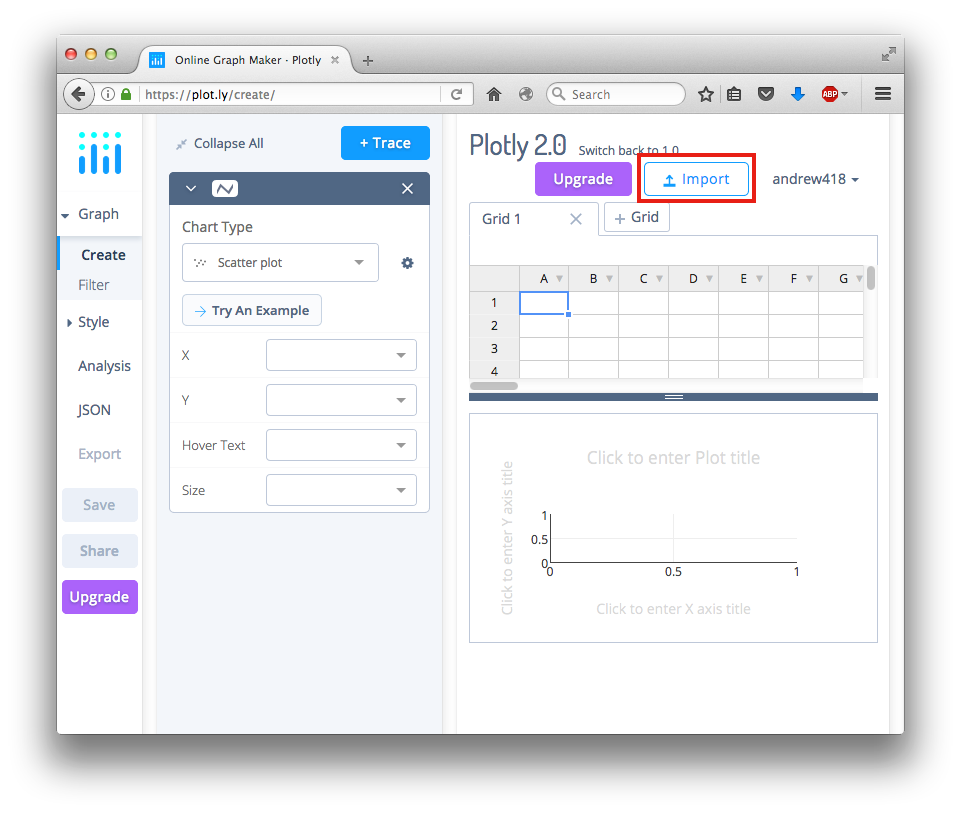
Once you have uploaded the data, two columns will be filled with values in the top right part of the screen. These columns will have the headings "BJD - 2454833" and "Corrected Flux". The column called "BJD - 2454833" gives the time of each observation. BJD, or Barycentric Julian Day, is a way of measuring time commonly used by astronomers. To find when these observations were taken, take any value from that column, for example the first timestamp 2307.55049, and add to this the number 2454833. The full BJD at that timestamp is 2457140.55049. Using an online tool, it is possible to convert BJDs into dates and times. Pasting 2457140.55049 into the box that says "Julian Date" and clicking "Compute Calendar Date" gives a result of April 28, 2015 at 1:12:42 AM Greenwich Mean Time. Afterwards, Kepler continued observing HIP 41378 nearly continuously until July 10, 2015. The column called "Corrected Flux" gives the measured brightness of the star at each of these times. The description "Corrected" means that apparent changes in brightness due to the peculiarities of how K2 works have been removed.
To create a plot, in the region to the left of the screen, fill in the "X" and "Y" boxes, shown highlighted below, with the "BJD-2454833" and "Corrected Flux" columns. You can also create or edit the title of the graph.
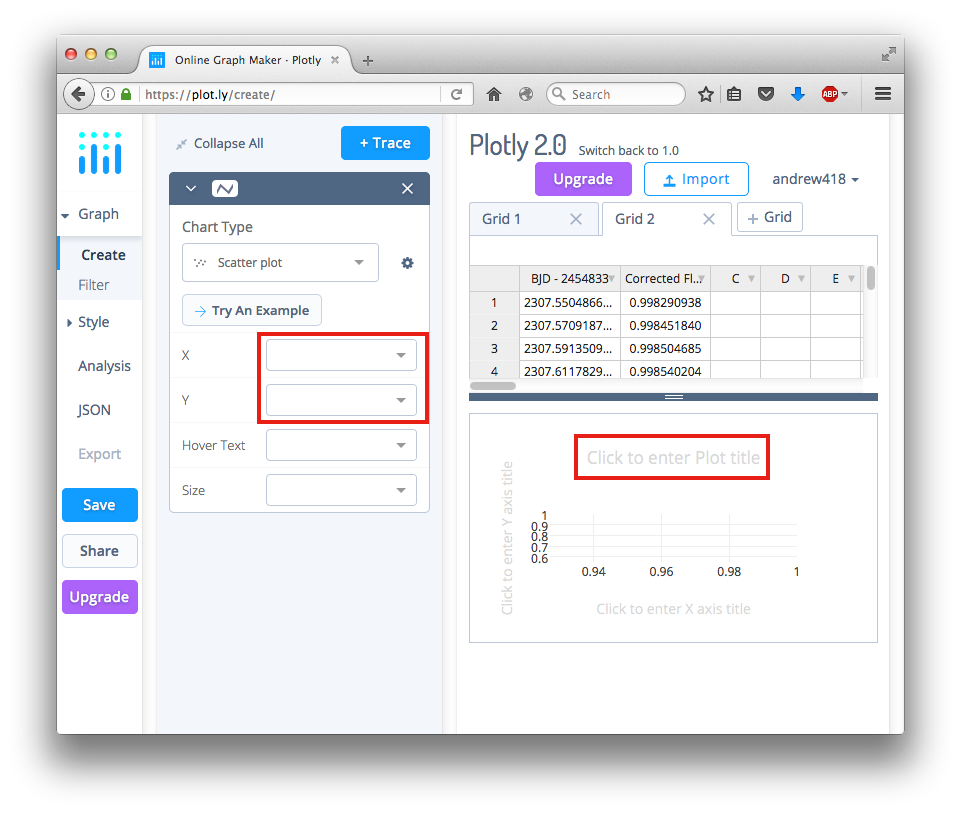
When completed, there should be a plot of the K2 light curve in the bottom right part of the screen.
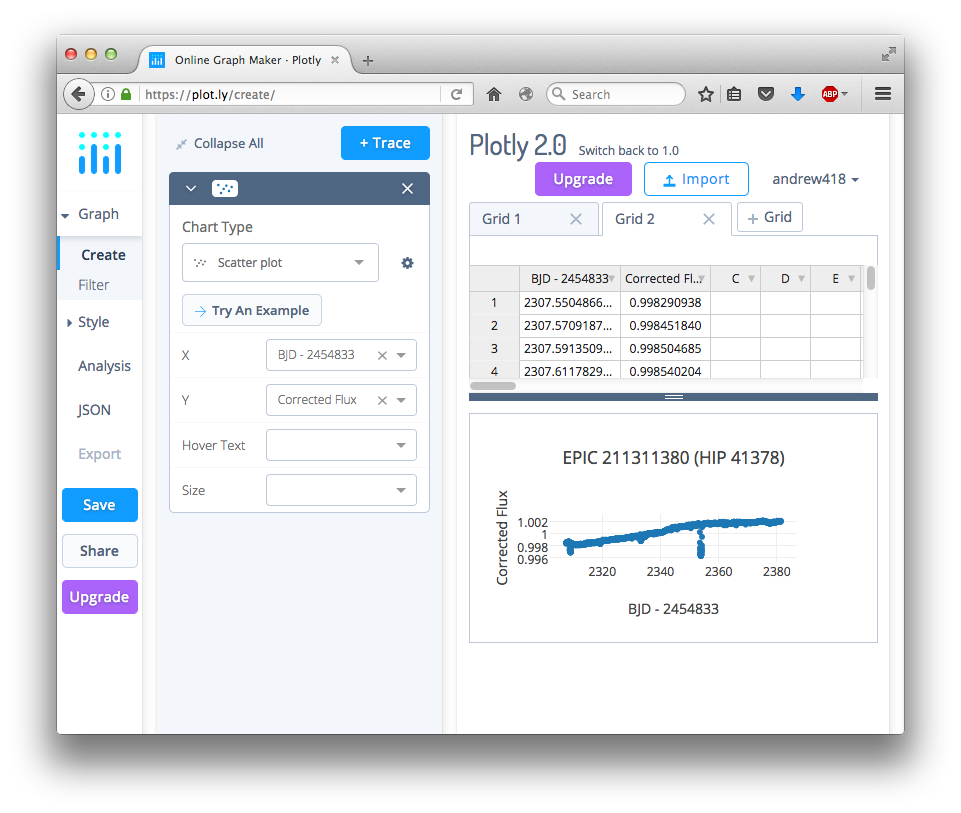
It is possible to zoom in on features in the light curve by clicking and dragging over the areas of interest.
Studying the HIP 41378 Planetary System
Below is an embedded Plot.ly plot of the K2 light curve of HIP 41378. This light curve shows a slow slope upwards (which is unimportant), and several dips throughout the light curve caused by transiting planets.
The first transit that jumps out is the deep one at BJD-2454833 = 2355. Zoom in on this transit and take a closer look. The top of the transit is at a flux level of about 1.00145 and the bottom of the transit is at a flux of about 0.9964. The transit depth is therefore 1.00145 - 0.9964 = 0.00505. From the first page of this tutorial, we therefore know that the ratio of the planet's radius to the star's radius is the square root of 0.00505, or 0.07106. But before we can measure the planet's size, we need to know the radius of the star.
Fortunately, estimates of the radius of most stars observed by K2 have been made by astronomers and are available online. These radius estimates are available via a search form linked here. To get the stellar radius estimate, type in the EPIC ID, or name of the star, or sky coordinates:
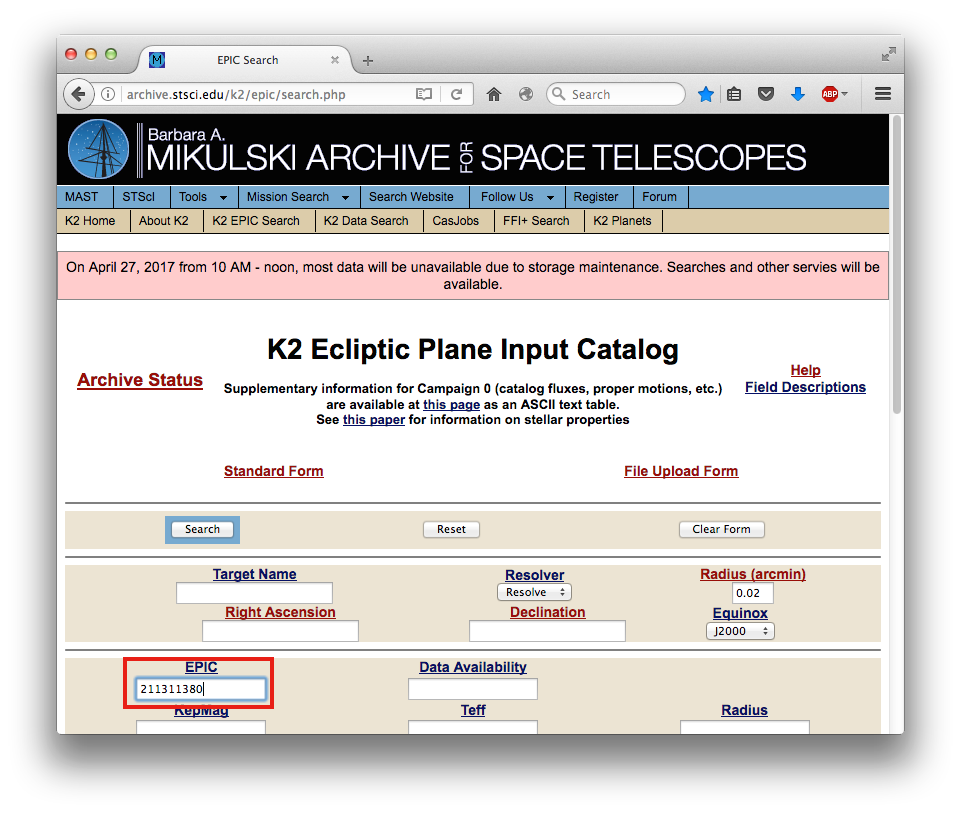
After submitting the form, results come up with lots of information about the star HIP 41378, including its brightness and other names:
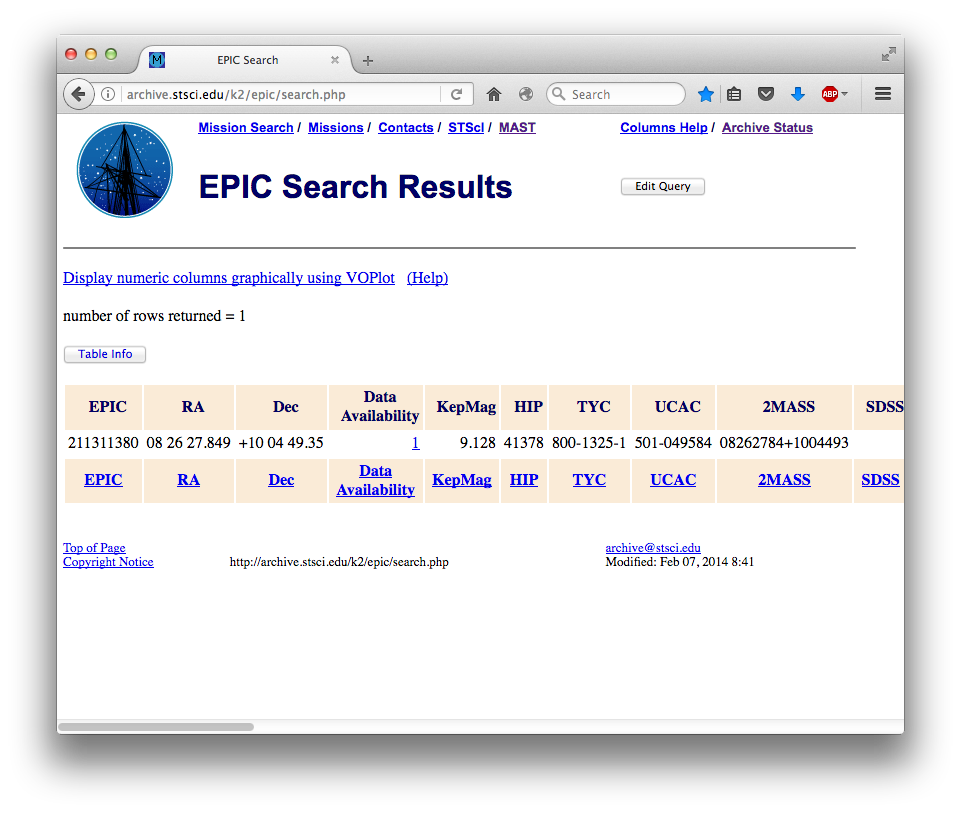
Scrolling all the way to the right shows a column giving the radius of the star. This estimate gives a radius of 1.506 times the size of the Sun.
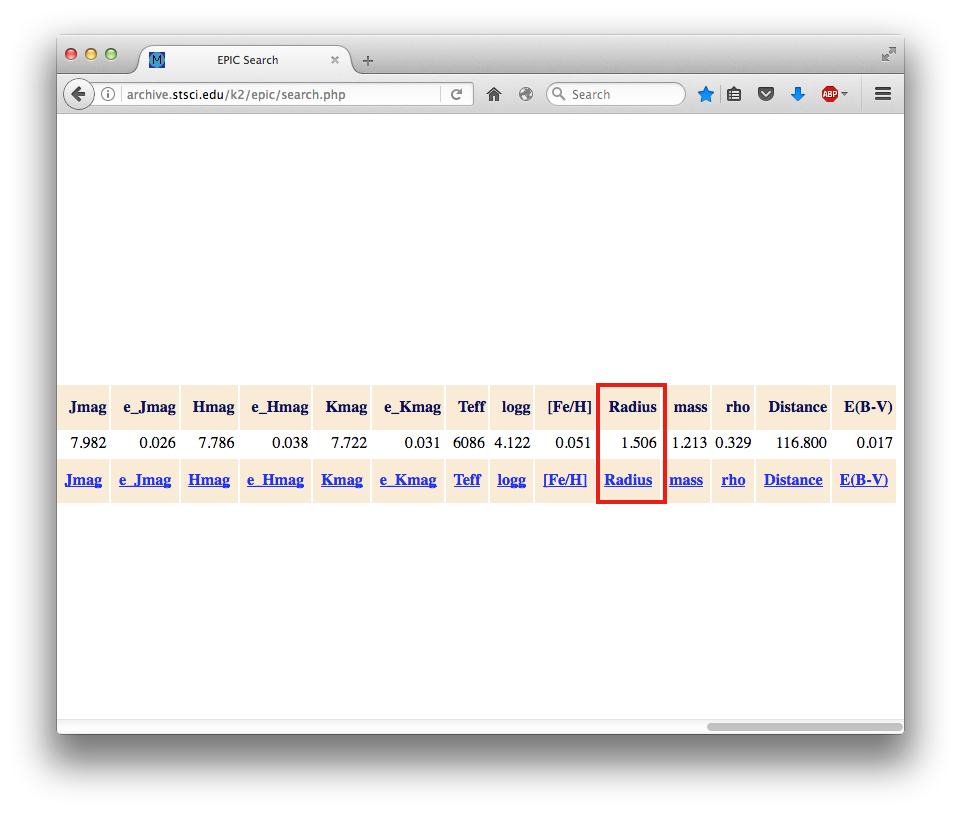
If we use a stellar radius of 1.5 times the size of the Sun, we get a planetary radius of about the size of Jupiter. This planet is likely a massive gas giant like Jupiter or Saturn in our own solar system.
But what is the orbital period of this planet? There are no other transits that are as deep and long-duration in the light curve, so its orbital period must be longer than about 40 days, or we would have seen another transit! It is difficult to constrain the period of a planet with only a single transit, but a careful analysis of the system concludes the orbital period of this planet is probably close to about 1 year - a similar orbit to the Earth. Recently, more observations from Kepler and telescopes on the ground measured the period to be 542 days, or about 18 months.
The light curve of HIP 41378 contains much more than just a single transiting planet. Take a careful look at the light curve, see how many transits there are, and try to figure out how many exoplanets orbit HIP 41378. Then, compare your results with what scientists determined after studying these planets, by reading this summary.